Hunting .NET memory leaks with Windbg
Recently a client called me about an issue where one of their production servers would run out of memory, every other week.
The application in question was a .NET Framework 4.5 Windows service, that runs in an Azure VM, and ever so often it would become unstable and start causing trouble.
I have previously helped this client set up an ELK stack, so it was quick for me to go into Kibana, look at
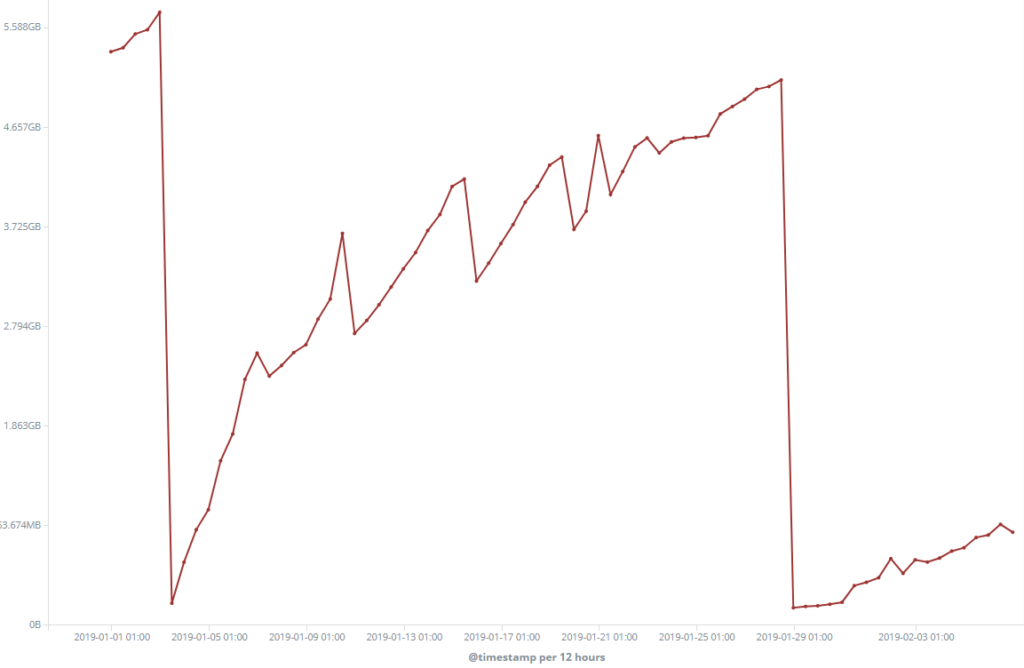
As you can clearly see, the application uses gradually more and more memory over time. Every time the line drops, was a restart of the server, where it went back to normal operation at about 150 MB.
When they initially called me, they had just restarted the application, so I had no real practical way of finding out what caused the memory right there and then, but I logged on to the server and created a memory dump for the recently restarted application, so I would have a baseline for how it looks during normal operation.
Creating a memory dump file
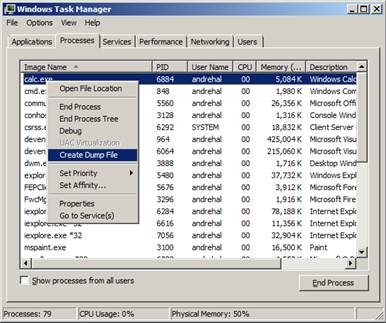
The best way to figure out what is causing a memory leak, is to analyse the memory of the running application. To do that, we need to make a “memory dump”, and thankfully on Windows this is straight forward.
- Open Task Manager.
- Go to the Processes(older) or Details(newer) tab
depending how new your operating system is. - Find the application in the list of processes.
Right click and choose “Create Dump file”.- A dialogue will appear and tell you the location of where the memory dump was saved.
This memory dump, is a snapshot of the applications memory, and the point in time you created the dump file. You can use this file to debug exceptions, callstacks, threads, deadlocks and in our case memory leaks!
Analyzing the memory dump file with Windbg
After a few days I came back and took another memory dump snapshot from the application, it had already double in its memory footprint, so comparing it to the baseline should quickly reveal where the issue was located.
To analyze a memory dump, multiple tools are available, and even Visual Studio has in some versions (Enterprise I believe?) a tool to analyze how the memory of a .NET application is put together.
We will be using Windbg Preview because it is free and a great tool to dig into more details of your applications dump file, even
Loading the debugger extension
Start Windbg, and then drag and drop the memory dump file right
.loadby sos clr // If .NET 4.0 or later
.loadby sos mscorwks // If .NET 3.5 or earlier
This command loads the SOS debugger extension for Windbg and basically helps Windbg understand how the memory is structured in managed programs, such as .NET applications, it provides detail about the internal Common Language Runtime(CLR) environment.
Analyzing the heap
When SOS is loaded, you can now view what is in the heap, where most .NET objects live. You do that by entering the following command:
!dumpheap -stat
This command dumps the heap, in a statistical summary, meaning that it shows all allocated objects, how many instants there are and how much memory that type of object uses in total.
The command will output the following result ordered by Total Size:
MT                      Count   Total Size     Class name
00007fff5d756bb0        9       288            System.Decimal
00007fff641dead8        7505    420248         com.mycompany.MyObject
00007fff641a6ad0        31108   1244320        System.Object[]
00007fff06289aa0        3859709 154388360      com.mycompany.PublishAction
The above table is heavily shortened to give an example of the output. In this table we are most interested in the Count (how many instances are currently allocated), the Total Size (how many bytes this type of object is using in total), and the Class name (the actual .NET class name).
From the above table, is it obvious that PublishAction is interesting to us, because it is registered 3.859.709 times, and uses 147 MB, which is quite a lot for an object that is supposed to be short-lived, as this one is.
At this
Finding the GC root
How garbage collection works, is out of scope for this article, but suffice it to say that as long as an Object has one or more “roots”, or references it will not be garbage collected. Windbg has tools for us to find all the roots or references to an object. First, we need to find a memory location of one of the objects, so we run the following command, to get all memory addresses of the allocated object.
!dumpheap -type com.mycompany.PublishAction
This dumps a huge list of memory addresses, so I usually just stop it immediately, and take one of the first results that are shown. It spits out 3 columns, Memory address, MethodTable Address and Size. We are only interested in the Memory address.
Address          MT                  Size
000000233aa4e6b8 00007fff0627cf10    40
000000233aa547f8 00007fff0627cf10    40
000000233aa62778 00007fff0627cf10    40
000000233aa669b8 00007fff0627cf10    40
Pick one of the memory addresses and use the following command to find the GCRoot.
!gcroot 233aa4e6b8
This will give you a result similar to this:
!gcroot 233aa4e6b8
Thread 50fc:
    000000235311edc0 00007fff64004770 System.Threading.ExecutionContext.RunInternal(System.Threading.ExecutionContext, System.Threading.ContextCallback, System.Object, Boolean)
        r14:
            ->  000000233a701500 System.Threading.ThreadHelper
            ->  000000233a7011a0 StackExchange.Redis.SocketManager
            -> ***OBS!!*** // I have omitted a lot of the noise
            ->  000000233a66d450 com.mycompany.cache.CacheService
            ->  000000233a729238 com.mycompany.cache.observer.ChannelSubscriber
            ->  000000233a7294b0 System.Collections.Generic.List`1[[com.mycompany.interfaces.observer.PubsubObserver, com.mycompany.interfaces]]
            ->  000000233a729600 com.mycompany.interfaces.observer.PubsubObserver[]
            ->  000000234b94bef8 com.mycompanyserver.common.actions.ActionQueue
            ->  000000233b2b0450 System.Collections.Generic.Queue`1[[com.mycompanyserver.common.actions.IAction, com.mycompanyserver.common]]
            ->  000000234b94bef8 com.mycompanyserver.common.actions.IAction[]
            ->  000000233b8905c0 com.mycompanygateway.common.actions.PublishAction
From the above result, we can tell that the root of this object is the Redis Socket manager, if we go down the list of references, we will see that it seems to be a subscription to the pubsub functionality in Redis that still have a reference to the class, we can then make an educated guess that it is probably the ActionQueue that did not unsubscribe correctly to from the pubsub.
And as expected, when I inspected the source code, I immediately saw that 3 subscriptions was created every time a client connected to the service, but only 2 of them were unsubscribed again. This would have taken me ages to figure out, if I had to search through the entire code base to figure out where something could have gone wrong.
By not assuming, and finding the facts before delving into code, it only took me about 15 minutes to figure out where the issue was, and another 15 minutes to make a code change, and push it to start a pull-request in my clients Git repository!
// André Snede Kock
Links and references:
 Advanced .NET Debugging
Advanced .NET debugging [Book]
Debugging managed code, memory leak with memory dump using windbg
Great that taking the memory dump with task manager worked for you. However, I would be very careful when doing that — it killed production application too many times for me. On the other hand, attaching WinDBG and doing .dump never failed.
Hmm good point! I have never had issues with it, but thanks for sharing your experience. That could cause a lot headaches if that happened!
EDIT: I actually experienced a crash after Cepewka mentioned this. It was in a web application though, so watch out when trying to take a dump with task manager!
Ӏ’m gone to say to my little brother, that
he should also visіt this website on reցular baѕis to
get some really great tips for programming in .NET, thanks a lot!
Awesome! This has been an incredibly wonderful article. Thanks for sharing!!
Tһаnks for your marvelous posting! I definitely enjoyed reading іt, you could be a great aᥙthoг.I will mɑke certain to bookmɑrk
your blog and dеfinitely ԝill come back later.
Have ɑ nice wеekend!